
After you log into the dashboard and select the desired location, follow the steps:
- On the sidebar, click on Location
- On the menu, click Sensors & Gateways
- Scroll down to the Connectivity chart, select the desired period and use the tabs to filter the data
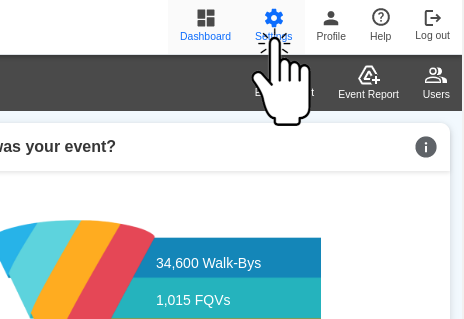
Step 1: Accessing Settings
On the top bar, click on Settings.
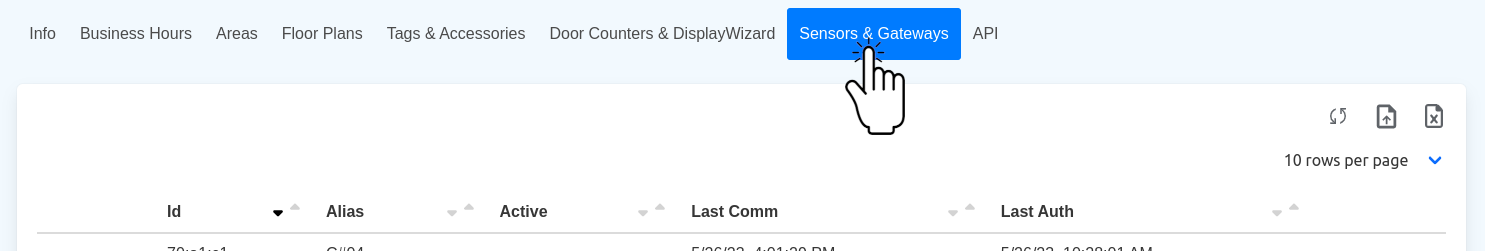
Step 2: Select Sensors & Gateways
On the menu, click Sensors & Gateways:
Step 3: Check the Connectivity Chart
Scroll down to the Connectivity chart, select the desired period and use the tabs to filter the data:
- Use the Best/Worst tab to check the sensors operating at the best and worst transmissions rate and the average.
- The Below 85% tab will list all sensors that operated under the recommended 85% transmission rate, represented by the horizontal red line.
- Under the All tab, you will find the details for every sensor.
Hover the mouse to see the details at each data point, or click on Spreadsheet Icon to export to a spreadsheet.
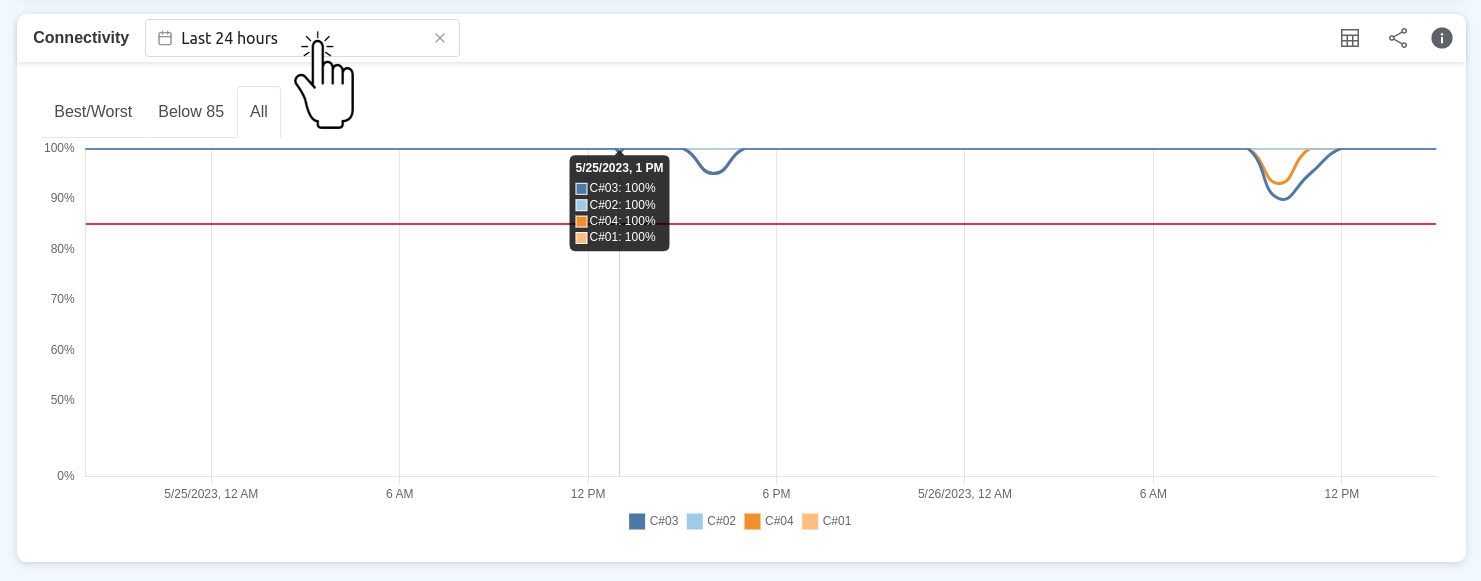
Note that the graph scale on the left side will change every time you select a different tab, adjusting the range to highlight the operational range. Therefore, the points at the bottom of the graph might not represent 0%. For example, the lowest point on the image above represents 50%, but it is close to the 0% horizontal ax.